: Pandas")
Data Science Workshop 1 (Part 3): Pandas
Welcome back. I am Dr. Shahriar Hossain. This is Part 3 of Data Science Workshop 1.
In the previous part, we discussed NumPy. In this one, we will start to discuss Pandas. The Pandas library for Python is designed for data processing and analysis. You can read data from files, process the data, and write to files using Pandas. We will see more utilization of Pandas to analyze data when we process data for machine learning algorithms.
Today, I will go over some quick examples of the basic data structures used in Pandas. The Pandas library is built on top of NumPy, which we are already familiar with from the previous part.
I am using Google Colab because it is incredibly convenient for running workshops, given that Google Colab is a cloud-based platform to run Python code.
Here is the YouTube video for Part 3.
Contents
Importing NumPy and Pandas
As I was saying, the Pandas library uses NumPy a lot. I will import both NumPy and Pandas. I generally import NumPy as np and Pandas as pd.
import numpy as np
import pandas as pd
These names np and pd are just names; you could name them whatever names you think are convenient for you. I will use these names to call functions relevant to NumPy and Pandas.
Generating a table of random number
I will generate some random numbers. Therefore, I am importing the randn function from numpy.random. This randn function will help me in generating some random numbers.
from numpy.random import randn
Now, one thing is, if you write code with me, your random numbers will be different than the random numbers the program will generate here in my code. That is obvious. Sometimes it may become confusing to see a video where numbers are different than the numbers you are using.
The seed function
To solve this issue, I am writing this next line where I state that the random number generator has an initial state of 50.
np.random.seed(50)
If you also include this line, then whatever random number I will generate in this program, your program will generate the same numbers. That is, you can use the same line with the value 50 to re-seed the generator. After re-seeding, if I generate a random number and you also generate a random number, both the random number will be the same. If I generate a second random number, it will be equal to your second random number. So and so forth.
Let me create a 5 by 4 matrix of random numbers as an example.
radt = randn(5, 4)
If you are writing code with me, you will see that you have the same random numbers.
If I run the line radt = randn(5, 4) again, I will see different numbers the second time. If you run this line a second time, you will have the same numbers as I have now on the screen.
That is quite an interesting feature, isn’t it? This seed function is quite good for testing purposes to reproduce the same random test data.
Many machine learning algorithms have the seed function to make sure that the initialization of the algorithm starts from the same state.
For the matrix, radt, I am running the re-seed at 50 line. Then I am generating the numbers after re-seeding. You will have the same matrix if you run this line first time after reseeding with 50.
It is fine if you do not write this line. In that case, my random numbers will be different than your random numbers.
Basic data structures in Pandas
The Pandas library has two basic data structures — Series and DataFrame. A Series is analogous to a one-dimensional array. A DataFrame is analogous to two-dimensional array. You can consider a DataFrame as an Excel sheet, where you have headers representing the names of the columns, or even rows can have names.
Creating a DataFrame
Let us directly create a DataFrame because DataFrame is something that a data scientist frequently uses to keep data in the main memory.
I will use this randomly generated data of five rows and four columns as my data in the DataFrame.
df1 = pd.DataFrame( radt, columns=['Hello1', 'Hello2', 'Hello3', 'Hello4'] )
pd is my Pandas reference. I use pd.DataFrame. The first parameter is the actual data part, which in this case is radt. I know that radt has five columns. I can tell my DataFrame that I have column names. I provide the column names as a list of Strings. Each element in the list will contain a string representing the header name of the column. I will mention that this list represents the column names. So I write columns = this list of strings.
I run this line to construct the respective DataFrame in variable df1. Now, I want to see what we have in this DataFrame. I print df1.
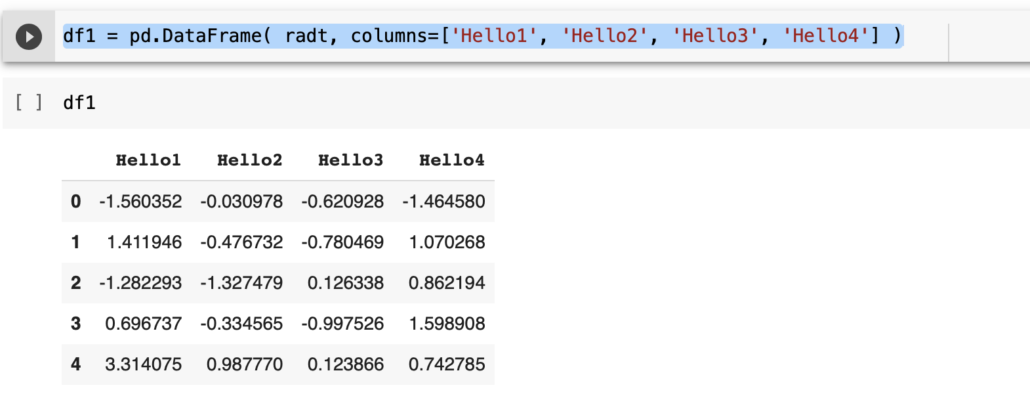
Notice that the four columns have a column header now. So, this DataFrame is like an excel data table. These row indices , 0 1, 2, 3, and 4, are not a part of the data but just row IDs provided by the DataFrame.
We could even provide our own index identifiers in the parameter just like the column header. We could provide index=a list of five elements as identifiers. Of course, the index list should ideally have five elements, given that we have five rows in the data. For the sake of simplicity, I am not including row names or row identifiers. We just have column identifiers or column names — Hello1, Hello2, Hello3, and Hello4.
Accessing/Retrieving a column
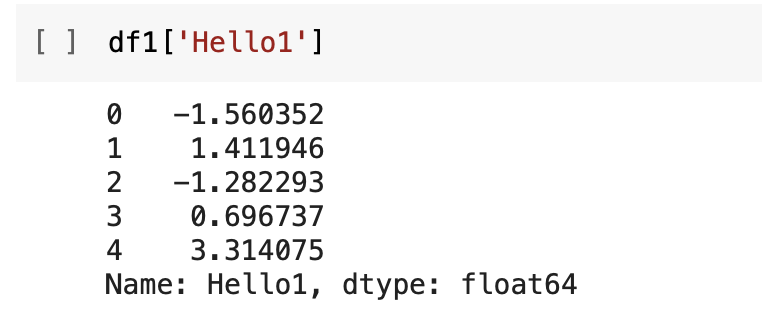
Now let’s say that we want to see only one column. Let’s say I want to see the column that has the header Hello1. I use df1, and in square brackets, I mention Hello1 in a quotation. The content of the column Hello1 is shown. The row indices are shown here too.
If I need to access two columns, I will provide a list of column names that I want to see within the first set of square brackets. That is, there will be two starting square brackets and two ending square brackets. Since I have provided a list of column names, those corresponding columns have been selected and displayed here.
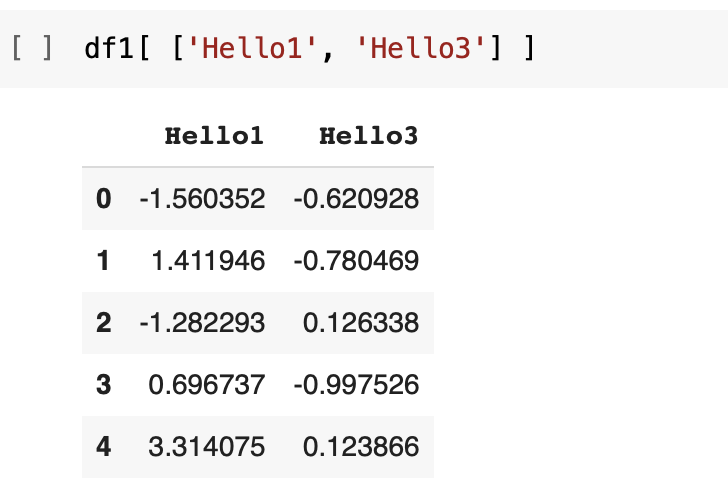
In this example, I have gathered the two columns Hello1 and Hello3 here. We have these two selected columns. Of course, we have the corresponding row indices in the display.
Code
The Google colab notebook can be downloaded from this zip file. Unzip to get the ipynb file that can be opened using Jupiter Notebook or Google Colab.
The python version of the code is as follows.
import numpy as np
import pandas as pd

from numpy.random import randn
np.random.seed(50)

radt = randn(5, 4)

print(radt)

df1 = pd.DataFrame( radt, columns=['Hello1', 'Hello2', 'Hello3', 'Hello4'] )

print(df1)

print(df1['Hello1'])

print(df1[ ['Hello1', 'Hello3'] ])
Here is the link to Part 4.