Data Science Workshop 2 (Part 3): k-means Clustering: An Unsupervised Machine Learning Algorithm
Hi, this is Dr. Shahriar Hossain again. Today, we will discuss an unsupervised machine learning algorithm and use the scikit-learn machine learning library.
The concept I will discuss is called clustering. The specific algorithm that we will look at is called the k-means clustering algorithm. We will discuss what it is, and then we will write a python program. Knowing what it is, is more than half the work done. After that, the code will be pretty straightforward.
Here is the youTube video.
Contents
- 1 What does a clustering algorithm do?
- 2 What does the k-means clustering algorithm do?
- 3 Data description
- 4 Will k-means work with large datasets?
- 5 What are inputs of k-means clustering?
- 6 What is the out of the k-means clustering algorithm?
- 7 Scikit-Learn for machine learning algorithms
- 8 The code
- 9 Suggestion
- 10 Limitations of k-means clustering
What does a clustering algorithm do?
Suppose you have a data table. A clustering algorithm will tell you which data points or which rows are in the same group. That is, rows that have similar features will be in the same cluster.
What does the k-means clustering algorithm do?
The purpose of the k-means clustering is to discover k groups of objects in data. If k=2, you are looking for two groups. If k=3, you are looking for three groups. If k=4, you are looking for four groups or clusters, so and so forth.
Data description
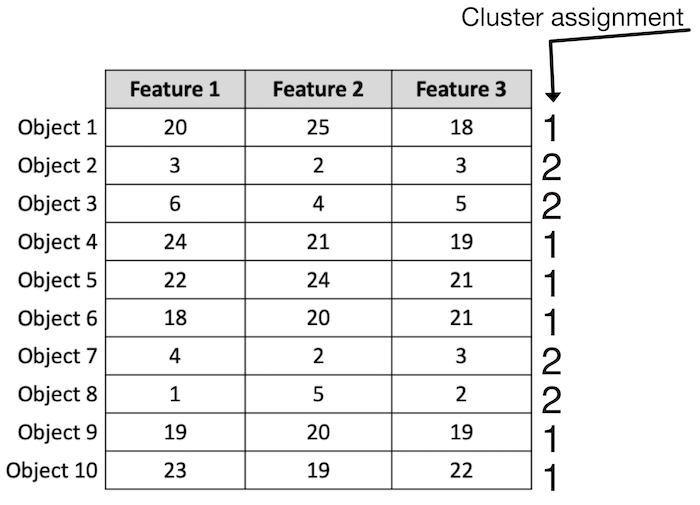
Consider that we have this table of data.
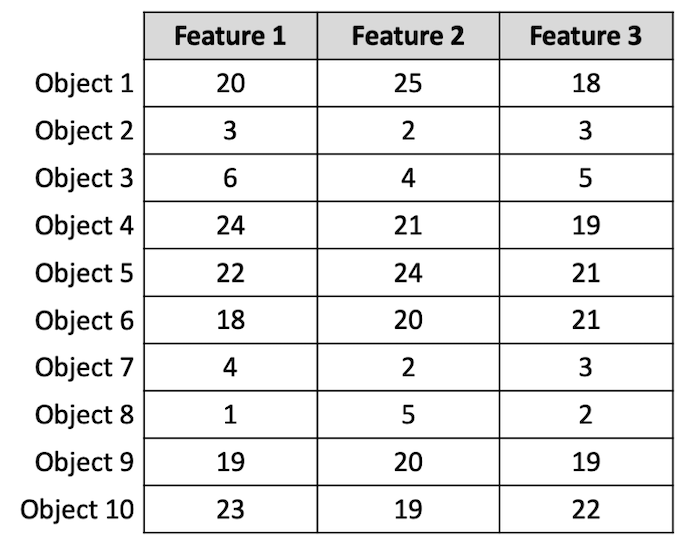
It has three columns, or features or, attributes. It has 10 objects or 10 rows. Now, notice that some of the rows have larger values compared to the other rows. The k-means clustering algorithm with k=2, will be able to separate objects into two groups.
These rows will be in one cluster.
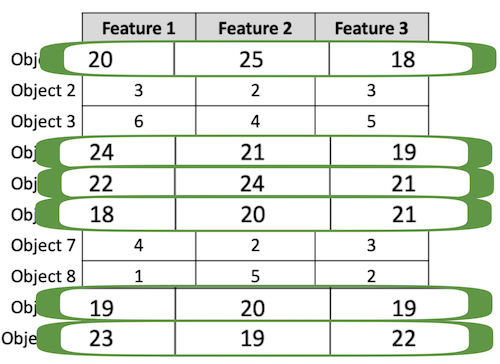
Let us say that these points will be in cluster 1. Notice that objects in cluster 1, have larger numbers in them.
The following rows will be in Cluster 2. Objects in Cluster 2 have smaller numbers in them.
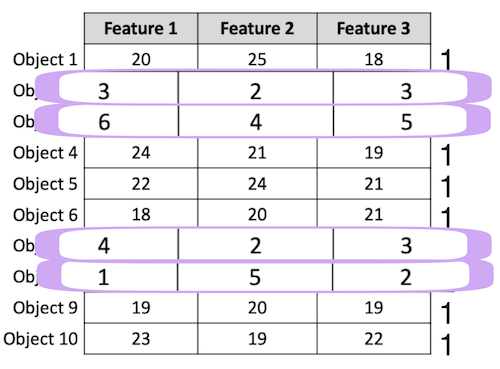
That is, in clustering, rows that have similar features will be in the same cluster.
In real data, all the features might not have all large values, or, all small values. Some features in the same row might be small, some features in the same row might be large. Also, there can be many features or columns in your data, making the data much more complex to create groups manually.
Furthermore, it is difficult to find groups of similar rows if you have too many rows. Finding groups might be difficult, even if you only have several hundred rows.
I will use this simple data table in a Python program to keep the discussion simple.
Will k-means work with large datasets?
You could have a large data table. The core part of the code will remain the same. The k-means clustering algorithm is scalable, which means that the algorithm works very well with large data tables.
What are inputs of k-means clustering?
The input of k-means clustering is the data, and k, which is the number of clusters. That you are giving the data, and you are saying that you want to discover k clusters.
What is the out of the k-means clustering algorithm?
The output of the k-means clustering algorithm is cluster assignment for each row. That is, for each row, the algorithm will give you a cluster assignment, which is an integer. For our running example , with k=2, a possible set of output is sown below.
Scikit-Learn for machine learning algorithms
I will use scikit-learn machine learning library, where the state-of-the-art clustering algorithms are already available. The the scikit-learn package has the name sklearn in Python. If you use Google colab, it is already installed there.
If you use Jupyter notebook or regular Python, you need to make sure that scikit-learn is installed on your local computer.
Here is the pip command for installing scikit-learn and integrate it with your existing Python on your computer would be:
pip install sklearn
If scikit-learn is not already installed, the command will install and integrate scikit-learn with Python.
The code
You can download the Google colab/Jupyter Notebook file (ipynb) by extracting this zipped file: mykmeans.zip .
The Python code is as follows. You can use any regular Python editor (such as Spyder) and copy and paste the following code. Save the code in a file with .py extension and then run it.
from sklearn.cluster import KMeans
import numpy as np

data = np.array(
  [[20, 25, 18],
  [3, 2, 3],
  [6, 4, 5],
  [24, 21, 19],
  [22, 24, 21],
  [18, 20, 21],
  [4, 2, 3],
  [1, 5, 2],
  [19, 20, 19],
  [23, 19, 22]]
)

km = KMeans(n_clusters=2).fit(data)

print(km.labels_)
Suggestion
Please go ahead with some practice. Please make sure to change the data in the code. Use more columns and more rows. I am sure you will find exciting things with your own datasets.
Limitations of k-means clustering
There are several limitations of k-means clustering.
- Your data table cannot have strings or categories. Data must be all numbers.
- Another limitation is, you have to play with k, the number of clusters to see if you have meaningful clusters. Researchers have, for many years, argued that users providing the number of clusters is a limitation. In modern data science, “being able to provide an expected number of clusters, k” is considered a strength because the user has some control in generating meaningful results.
In the next part, we will see how we can visualize the data and the clusters that the k-means clustering algorithm has produced. See you in the next video soon.
The next part discusses how to visualize data points and clusters using Matplotlib.
