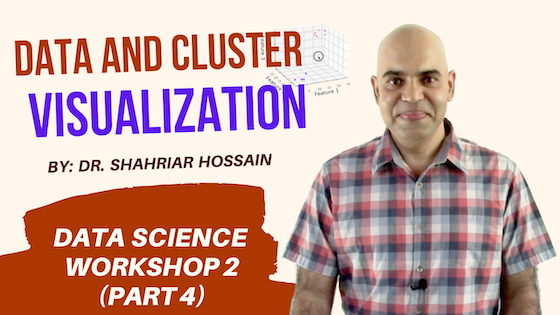
Data Science Workshop 2 (Part 4): Data and Cluster Visualization
In this part I discussed how we can visualize data points and clusters formed by those data points.
The library we used is called Matplotlib. I imported the pyplot facilities of Matplotlib for the visualization of data points using Python.
Here is the YouTube video will the details.
The notebook file written in the video, using Google colab, can be found here: plot_test.zip.
