What are “space” and a “high-dimensional space”?
What do we mean by space in data science?
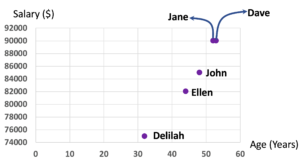
In data science, we use the word “space” to refer to the mathematical space. For example, if we have a two-dimensional dataset like the following one, a space with two axes is formed.
| Name | Salary ($) | Age (Years) |
| Jane | 90000 | 52 |
| John | 85000 | 48 |
| Delilah | 75000 | 32 |
| Dave | 90000 | 53 |
| Ellen | 82000 | 44 |
One of the two axes will be Age, and the other one will be Salary. Let us put age in the horizontal axis and Salary in the vertical axis.

Notice that each object of the dataset has become a point in the space. The space is two-dimensional (has two axes) because the dataset is two-dimensional (the dataset has two features). Hence, the dimension of a dataset actually refers to the space the dataset creates.
Jane and Dave have the same salary; that is why their positions in the vertical-axis are the same. Dave is one year older than Jane; that is why the marker for Dave is a bit right to the marker of Jane.
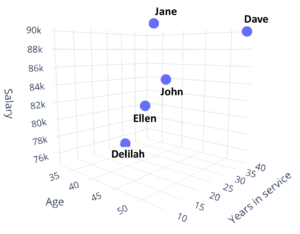
With three features — Salary, Age, and Years of service — the data becomes three-dimensional.
| Name | Salary ($) | Age (Years) | Years of service |
| Jane | 90000 | 52 | 10 |
| John | 85000 | 48 | 20 |
| Delilah | 75000 | 32 | 30 |
| Dave | 90000 | 53 | 40 |
| Ellen | 82000 | 44 | 20 |
As a result, our data space will become three-dimensional. We can plot our points, which are the rows of the data in a three-dimensional space like the following one.

You might have recalled by this time that the space we are talking about is the Euclidean space from geometry, where there is an origin point with zero values for any axis. There are are two parts along any axes – one side contains positive values and another side contains negative values. The most common Euclidean spaces used in geometry are two-dimensional and three-dimensional spaces.
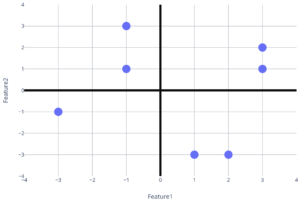
An example of a two-dimensional Euclidean space is as follows. Each point in a two-dimensional Euclidean space has two values (x-value and y-value.) These values actually correspond to the two-features of the two-dimensional dataset.

The Euclidean space above is generated from the following data of two features.
| -1 | 3 |
| 3 | 2 |
| -1 | 1 |
| 3 | 1 |
| 1 | -3 |
| 2 | -3 |
| -3 | -1 |
What happens if we have four features? Practically, we have a four-dimensional space. However, we do not have the capacity to visualize the four-dimensional space because we practically live in a three-dimensional space. Note that, we still have the data and the corresponding four-dimensional space that we can use for any mathematical operations. We just cannot visualize the space.
An example of a four-dimensional space is provided below.
| Salary ($) | Age (Years) | Years of service | Another feature |
| 90000 | 52 | 10 | 1 |
| 85000 | 48 | 20 | 2 |
| 75000 | 32 | 30 | 3 |
| 90000 | 53 | 40 | 2 |
| 82000 | 44 | 20 | 1 |
Same about five features or a five-dimensional space — there can be a five-dimensional space resulting from a five-dimensional dataset but we cannot visualize anything with more than three dimensions because our eyes can only process up to three dimensions. An example of a fived-dimensional dataset is as follows.
| Salary ($) | Age (Years) | Years of service | Another feature | Another another feature |
| 90000 | 52 | 10 | 1 | 10 |
| 85000 | 48 | 20 | 2 | 2 |
| 75000 | 32 | 30 | 3 | 3 |
| 90000 | 53 | 40 | 2 | 5 |
| 82000 | 44 | 20 | 1 | 5 |
If we have 100 features then we have a 100-dimensional space. If we have 1000 features, then we have a 1000-dimensional dataset.
In general, if we have k features, we have a k-dimensional dataset.
What is a high dimensional space?
A dataset with a number of dimensions greater than three is generally referred to as high dimensional data. However, the phrase “high dimensional” is vague. When it is text data, you can consider that you have several thousand to several tens of thousands of dimensions. If you have data that stores health information of people, you can consider that you have a few tens of dimensions to a little over a hundred dimensions.
Many of the algorithms we will learn are highly impacted by the number of dimensions or number of features of the data. This is why the number of dimensions is an important factor.
You might ask, isn’t the number of rows a factor as well. Yes, it is. But it is naturally expected that the more objects, or rows you have the more time the algorithm will take. If we have more features the runtime sometimes increases quite unexpectedly. You will hear things like this algorithm is good for a large dataset with low dimensional features. Or, that algorithm works better for high dimensional dataset compared to this one. The phrase “big data” is not only contributed by the number of objects, but also by the number of features or dimensions.

12 Comments
So wonderful lecture, I have been tought clearly More than that
the three dimension is a bit confusing
Sorry to hear that it was confusing. I hope moving forward will clarify things more. Thank you for your feedback.
very interesting topic and you have well explained it.
Thanks
Excellent!
I am glad to know that you liked it. Have a wonderful week.
Very good lecture! Language & expression used is very easy to understand & convincing!
I am glad to hear that you liked the video lectures. We will post more video lectures in the coming months. Please stay tuned.
that was a very clear and precise explanation of what the space is and it’s relation to the dimensions
I am glad to know that the concept was clear from the video lecture. Thank you! We will make more videos in the coming months. Please stay tuned.
Awesome lectures
Glad to know that you liked the lectures. Thank you for watching. Have a wonderful weekend ahead.